
It has been a blast learning Kubernetes. I’ve been aware of K8s for a long time but found it too complex and overwhelming compared to Docker. However, I now understand why that complexity exists and the problems it solves. I definitely wish I took the leap sooner.
This article outlines the starter projects I’ve deployed to solidify my understanding of those principles and fundamentals.
Rancher Desktop Deployment#
For testing I went with Rancher Desktop. Rancher Desktop is an open-source application that provides all the essentials to work with containers and Kubernetes on the desktop.
In addition to providing a GUI and shipping with K3s and its accompanying defaults (Traefik ingress controller, Flannel CNI, containerd and CoreDNS.) Instead of deploying this in a virtual machine on my Proxmox host, I decided to deploy it on my beefy Ryzen 9 7950x3d desktop PC.
The official documentation doesn’t include instructions for Arch Linux, so I followed the Installation documentation for setup requirements and adapted them to Arch: Check if user has required permissions for /dev/kvm:
[ -r /dev/kvm ] && [ -w /dev/kvm ] || echo 'insufficient privileges'The command below adds the current user to the “KVM” group:
sudo usermod -a -G kvm "$USER"Rancher Desktop makes use of Traefik as the default ingress controller. Users may run into a permission denied error after deploying Rancher Desktop due to restricted port access on the Traefik ingress. Most Linux distributions do not allow non-root users to listen on TCP and UDP ports below 1024. In order to allow Traefik to listen to privileged ports on the local host
I adapted the persistent config of sudo sysctl -w net.ipv4.ip_unprivileged_port_start=80 to work with Arch Linux.
Arch has a /etc/sysctl.d/ directory instead of a /etc/sysctl.conf file, so I created the file below in that directory.
sudo sh -c 'echo "net.ipv4.ip_unprivileged_port_start=80" >> /etc/sysctl.d/99-rancher-desktop.conf'
# save and apply
sudo sysctl --system
I installed Rancher Desktop, kubectl and k9s using paru:
paru -S rancher-desktop-bin kubectl k9sProjects#
Below are starter projects I deployed to improve my understanding of Kubernetes fundamentals and principles.
Mealie#
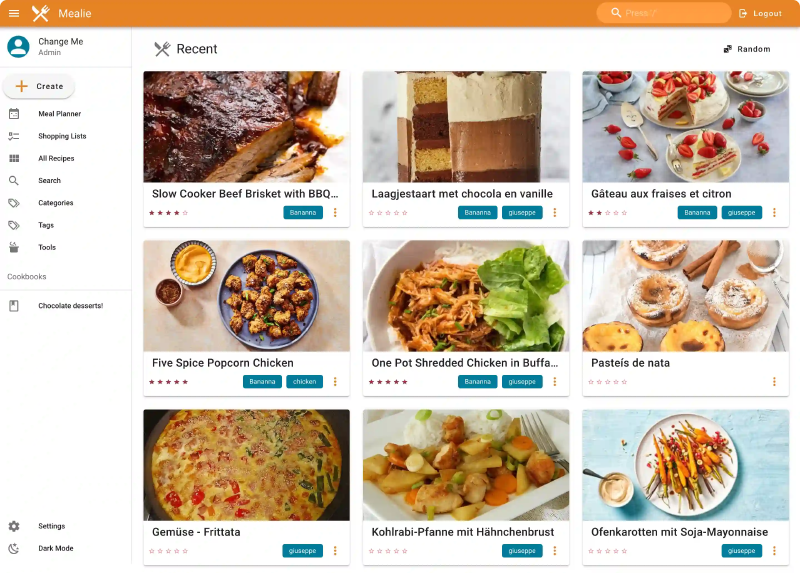
App deployment#
Taking all the info above to deploy a Docker-native app with Kubernetes:
- Created a blank deployment file with an nginx image as the base using
kubectl create deploymentand outputting it to mealie.yaml. - Replaced nginx name/labels/matchlabels with mealie and added mealie namespace under metadata.
- Looked up specific Docker tags to pull with documentation “ghcr.io/mealie-recipes/mealie:v1.2.0”.
- Applied the deployment and used kubectl get pods -o wide and/or kubectl describe pods mealie to get the IP.
- Port-forwarded the mealie pod using
kubectl port-forward pods/mealie 9000to forward the port to localhost or 127.0.0.1:9000 (as long as the terminal is open).kubectl port-forward -n mealie pods/mealie 9000. - Amended mealie version to
ghcr.io/mealie-recipes/mealie:v3.8.0.
apiVersion: apps/v1
kind: Deployment
metadata:
  labels:
    app: mealie
  name: mealie
  namespace: mealie
spec:
  replicas: 1 #Default DB doesn't support concurrent write from multiple instances. Might try PSQL later
  selector:
    matchLabels:
      app: mealie
  template:
    metadata:
      labels:
        app: mealie
    spec:
      containers:
      - image: ghcr.io/mealie-recipes/mealie:v1.2.0
        name: mealie
        ports:
          - containerPort: 9000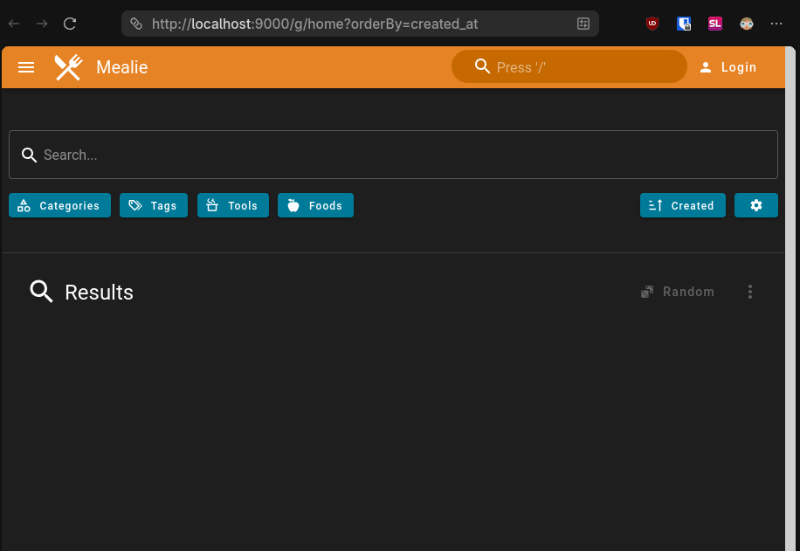
Mealie Service Creation#
- Exposed the mealie deployment which creates a mealie svc.
kubectl expose deployment mealie --port 9000. - Port-forwarded the mealie service to access on localhost.
kubectl port-forward services/mealie 9000. Port forward needs to be declared as code to free up the shell. - Outputted the service config to yaml via
kubectl get svc mealie -o yaml > service.yaml.
apiVersion: v1
kind: Service
metadata:
  labels:
    app: mealie
  name: mealie
  namespace: mealie
spec:
  clusterIP: 10.43.209.83
  clusterIPs:
  - 10.43.209.83
  internalTrafficPolicy: Cluster
  ipFamilies:
  - IPv4
  ipFamilyPolicy: SingleStack
  ports:
  - port: 9000
    protocol: TCP
    targetPort: 9000
  selector:
    app: mealie
  sessionAffinity: None
  type: ClusterIP
status:
  loadBalancer: {}
Cleaned up the output and set type to “LoadBalancer” to expose the service via external IP.
apiVersion: v1
kind: Service
metadata:
  labels:
    app: mealie
  name: mealie
  namespace: mealie
spec:
  ports:
  - port: 9000
    protocol: TCP
    targetPort: 9000
  selector:
    app: mealie
  type: LoadBalancer
Output of kubectl get svc after applying**, and** mealie is now accessible via localhost.
kubectl get svc
NAME       TYPE           CLUSTER-IP     EXTERNAL-IP    PORT(S)          AGE
mealie LoadBalancer 10.43.216.8 192.168.5.15 9000:31940/TCP 4m33sAdding a Persistent Volume#
PVC Yaml:
apiVersion: v1
kind: PersistentVolumeClaim
metadata:
  name: mealie-data-pvc
  namespace: mealie
spec:
  accessModes:
    - ReadWriteOnce
  resources:
    requests:
      storage: 500Mi
The PV isn’t specified and mounted to the pod so the status is left at pending.
❯ kubectl get persistentvolumeclaims
NAME          STATUS    VOLUME   CAPACITY   ACCESS MODES   STORAGECLASS   VOLUMEATTRIBUTESCLASS   AGE
mealie-data-pvc   Pending
And no resources can be found via kubectl get persistentvolume.
❯ kubectl get persistentvolume
No resources found
Added a mealie-data volume pointed to mealie-data-pvc and created a volumeMount for mealie referencing it and /app/data inside the pod.
apiVersion: apps/v1
kind: Deployment
metadata:
  labels:
    app: mealie
  name: mealie
  namespace: mealie
spec:
  replicas: 1
  selector:
    matchLabels:
      app: mealie
  template:
    metadata:
      labels:
        app: mealie
    spec:
      containers:
      - image: ghcr.io/mealie-recipes/mealie:v3.8.0
        name: mealie
        ports:
          - containerPort: 9000
        volumeMounts:
          - mountPath: /app/data
            name: mealie-data
      volumes:
        - name: mealie-data
          persistentVolumeClaim: # PVC Claim in storage.yaml
            claimName: mealie-data-pvc
The PVC is now bound in kubectl get persistentvolumeclaims and kubectl get persistentvolume.
❯ kubectl get persistentvolumeclaims
NAME              STATUS   VOLUME                                     CAPACITY   ACCESS MODES   STORAGECLASS   VOLUMEATTRIBUTESCLASS   AGE
mealie-data-pvc   Bound    pvc-a1ff5928-9ae8-478a-b162-173915cf7174   500Mi      RWO            local-path     <unset>                 9m44s
❯ kubectl get persistentvolume
NAME CAPACITY ACCESS MODES RECLAIM POLICY STATUS CLAIM STORAGECLASS VOLUMEATTRIBUTESCLASS REASON AGE
pvc-a1ff5928-9ae8-478a-b162-173915cf7174 500Mi RWO Delete Bound mealie/mealie-data-pvc local-path <unset> 7m58sThe saved recipe persists after the deployment is deleted and recreated**.**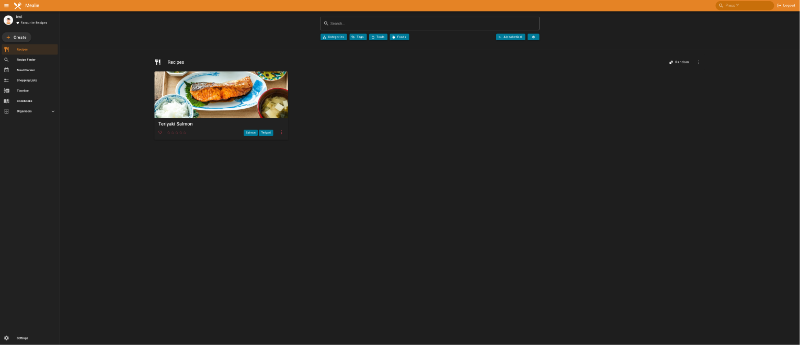
Linkding#
Linkding is a self-hosted bookmark manager. It’s another example of an app that doesn’t provide a Helm chart or installation instructions for Kubernetes. So it was more practise for figuring out how to configure a Docker-native app to work with a Kubernetes deployment.
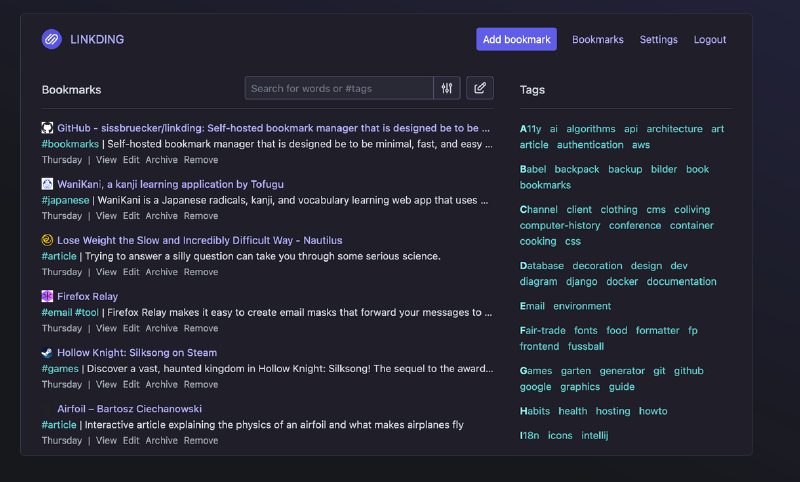
Found a tagged Docker image repo to use as a reference: ghcr.io/sissbruecker/linkding:1.44.2-plus-alpine.
Deployed linkding mirroring the mealie setup (deployment, namespace and service yaml files):
Deployment.yaml (“Error from server (NotFound): error when creating “deployment.yaml”: namespaces “linkding” not found”. Fixed after running namespace.yaml first).
apiVersion: apps/v1
kind: Deployment
metadata:
  labels:
    app: linkding
  name: linkding
  namespace: linkding
spec:
  replicas: 1 #Default DB doesn't support concurrent write from multiple instances. Might try PSQL later
  selector:
    matchLabels:
      app: linkding
  template:
    metadata:
      labels:
        app: linkding
    spec:
      containers:
      - image: ghcr.io/sissbruecker/linkding:1.44.2-plus-alpine
        name: linkding
        ports:
          - containerPort: 9090
Namespace.yaml:
apiVersion: v1
kind: Namespace
metadata:
  name: linkding
spec: {}
status: {}
Service.yaml:
apiVersion: v1
kind: Service
metadata:
  labels:
    app: linkding
  name: linkding
  namespace: linkding
spec:
  ports:
  - port: 9090
    protocol: TCP
    targetPort: 9090
  selector:
    app: linkding
  type: LoadBalancer
The Linkding user setup command is tailored to Docker/Docker Compose installation:
docker exec -it linkding python manage.py createsuperuser --username=joe --email=joe@example.comConverted to work with kubectl:
kubectl exec -it linkding -- /bin/bash
python manage.py createsuperuser --username=test --email=linkding-test@example.com #seperated commands as kubectl treated email flag as unknown
![[image-86.png|1280x387]]
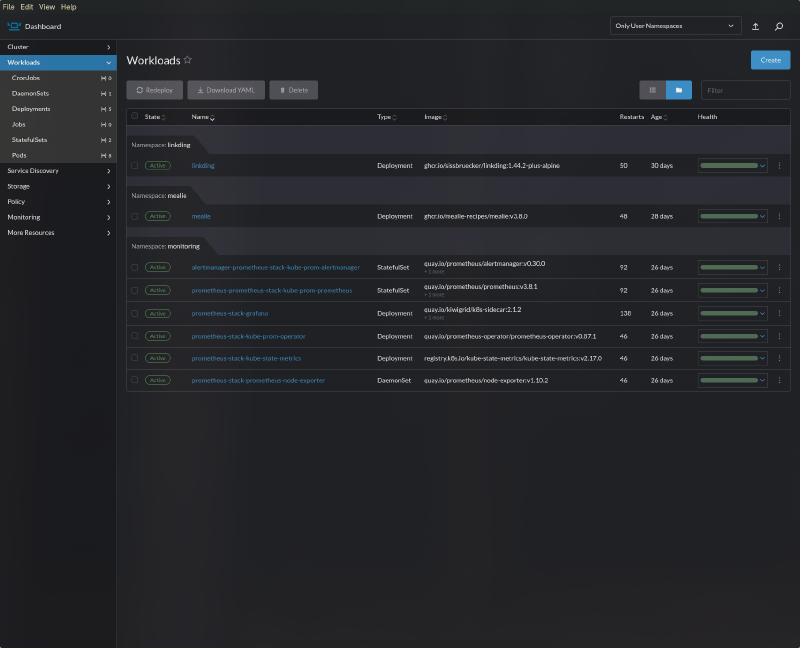
Kube Prometheus Stack#
The de facto stack for Kubernetes monitoring is Prometheus + Grafana. This stack is used at the enterprise level to monitor Kubernetes. This monitoring stack is responsible for collecting metrics and visualising them. Metrics in this context are data which are used to assess the performance of a status or process, i.e. CPU/RAM usage, failed processes. This project is deployed via the use of Helm charts instead of manually writing manifests.
Installation of traditional Helm chart:
 helm repo add prometheus-community https://prometheus-community.github.io/helm-charts
 helm repo update
 helm install prometheus-stack prometheus-community/kube-prometheus-stack --namespace=monitoring --create-namespace
Output after installation:
NAME: prometheus-stack
LAST DEPLOYED: Sat Dec 27 00:48:26 2025
NAMESPACE: monitoring
STATUS: deployed
REVISION: 1
NOTES:
kube-prometheus-stack has been installed. Check its status by running:
kubectl --namespace monitoring get pods -l "release=prometheus-stack"

Get Grafana 'admin' user password by running:

kubectl --namespace monitoring get secrets prometheus-stack-grafana -o jsonpath="{.data.admin-password}" | base64 -d ; echo

Access Grafana local instance:

export POD_NAME=$(kubectl --namespace monitoring get pod -l "app.kubernetes.io/name=grafana,app.kubernetes.io/instance=prometheus-stack" -oname)
kubectl --namespace monitoring port-forward $POD_NAME 3000

Get your grafana admin user password by running:

kubectl get secret --namespace monitoring -l app.kubernetes.io/component=admin-secret -o jsonpath="{.items[0].data.admin-password}" | base64 --decode ; echo

Visit https://github.com/prometheus-operator/kube-prometheus for instructions on how to create & configure Alertmanager and Prometheus instances using the Operator.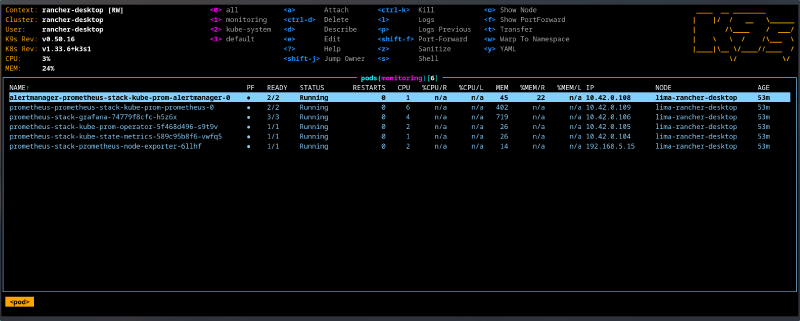
Pod Explanations#
prometheus-prometheus-stack-kube-prom-prometheus-0 - Collects and stores metrics as “time series”, meaning the metrics are stored with time stamps. The time stamps allow us to see the development of metrics over time, i.e.CPU/RAM usage over days/weeks/months.
alertmanager-prometheus-stack-kube-prom-alertmanager-0 - Used to configure alerts, which can be configured to trigger if specific metrics exceed a specified threshold, i.e.,node, CPU, temperatures, storage space. Has support for a wide range of notification methods, the full list is available here. Common methods include: Jira, SMTP, Slack, Telegram.
prometheus-stack-grafana-74779f8cfc-h5z6x - Grafana, the component that visualises metrics gathered by Prometheus.
prometheus-stack-kube-prom-operator-5f468d496-s9t9v - Simplifies the deployment of Prometheus, its accompanying resources and configuration of monitoring via CRDs. Allows you to write a simple yaml file called a pod monitor which will monitor all pods with a specific label attached.
prometheus-stack-kube-state-metrics-589c95b8f6-vwfq5 - Listens to the Kube API server and generates metrics about the state of objects (such as deployments and pods) and forwards these metrics to Prometheus.
prometheus-stack-prometheus-node-exporter-6llhf - Agent that runs on all the cluster nodes and collects metrics about their performance.
Accessing Grafana Dashboard#
The dashboard needs to be exposed using:
export POD_NAME=$(kubectl --namespace monitoring get pod -l "app.kubernetes.io/name=grafana,app.kubernetes.io/instance=prometheus-stack" -oname)
kubectl --namespace monitoring port-forward $POD_NAME 3000
Default values of login credentials would normally be found by exporting values of a Helm chart to yaml:
helm show values prometheus-community/kube-prometheus-stack > prometheus-default-values.yamlUnfortunately, the “prometheus-default-values.yaml” default “adminPassword” is commented out. ![[image-52.png|1386x557]] It could be enabled in a separate custom-values.yaml (matching original formatting/indentation of course) and injected via:
helm upgrade prometheus-stack prometheus-community/kube-prometheus-stack --namespace=monitoring --values custom-values.yamlBut it is better practise to pull the current value from secrets using the command below as advised by the Helm chart earlier.
kubectl get secret --namespace monitoring -l app.kubernetes.io/component=admin-secret -o jsonpath="{.items[0].data.admin-password}" | base64 --decode ; echoAutomating port forward#
A load balancer service needs to be created so a shell kubectl port forward doesn’t need to be kept.
Used mealie service.yaml as a reference:
apiVersion: v1
kind: Service
metadata:
  labels:
    app: mealie
  name: mealie-service
  namespace: mealie
spec:
  ports:
  - port: 9000
    protocol: TCP
    targetPort: 9000
  selector:
    app: mealie
  type: LoadBalancer
Queried existing prometheus-stack-grafana service for selector:
❯ k get service prometheus-stack-grafana -o wide
NAME                       TYPE        CLUSTER-IP     EXTERNAL-IP   PORT(S)   AGE     SELECTOR
prometheus-stack-grafana   ClusterIP   10.43.173.89   <none>        80/TCP    3h14m   app.kubernetes.io/instance=prometheus-stack,app.kubernetes.io/name=grafana
Amended values for the prometheus-grafana-stack. The service contains two selectors: app.kubernetes.io/instance=prometheus-stack and app.kubernetes.io/name=grafana, which need to be separated and formatted in yaml.
apiVersion: v1
kind: Service
metadata:
  labels:
    app: grafana
  name: grafana-loadbalancer #name of the service
  namespace: monitoring
spec:
  ports:
  - port: 3000
    protocol: TCP
    targetPort: 3000
  selector:
    app.kubernetes.io/instance: prometheus-stack
    app.kubernetes.io/name: grafana
  type: LoadBalancer
Can successfully access the dashboard after applying the file.
❯ k get service grafana-loadbalancer -o wide
NAME                   TYPE           CLUSTER-IP    EXTERNAL-IP    PORT(S)          AGE   SELECTOR
grafana-loadbalancer   LoadBalancer   10.43.66.34   192.168.5.15   3000:32628/TCP   19m   app.kubernetes.io/instance=prometheus-stack,app.kubernetes.io/name=grafana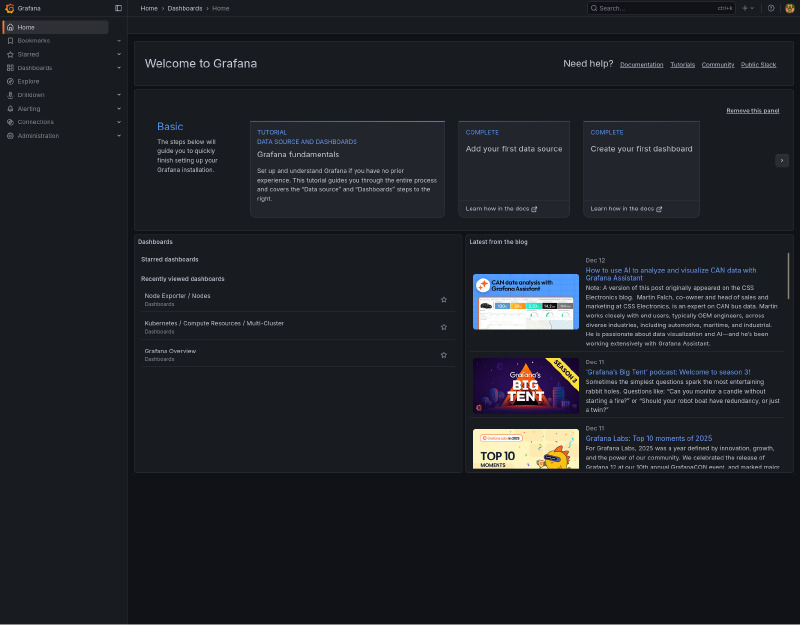
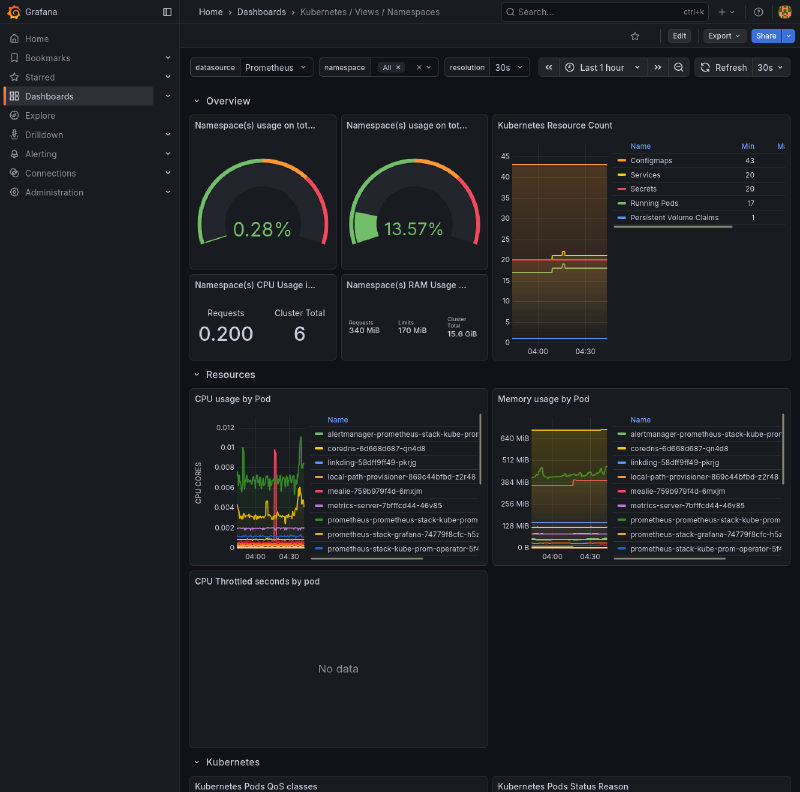
Custom Dashboard for Namespaces#
- Imported a custom dashboard json file created by Mischa. The dashboard is centred around metrics for namespaces.
Next Step#
With a basic understanding of Kubernetes fundamentals solidified with these projects, it’s time to move on to GitOps. Once again, all of the code for these projects can be found on my Labs repo.
Beats to Listen to#
Amos Roddy - Citizen Sleeper 2 OST
The story and art style of this game already suck you in. Then the music comes in, and makes you never want to leave (speaking from experience). Personal favourites: A Different Sun, Little Sister, Senna’s Rest, Another Cycle, Darkside